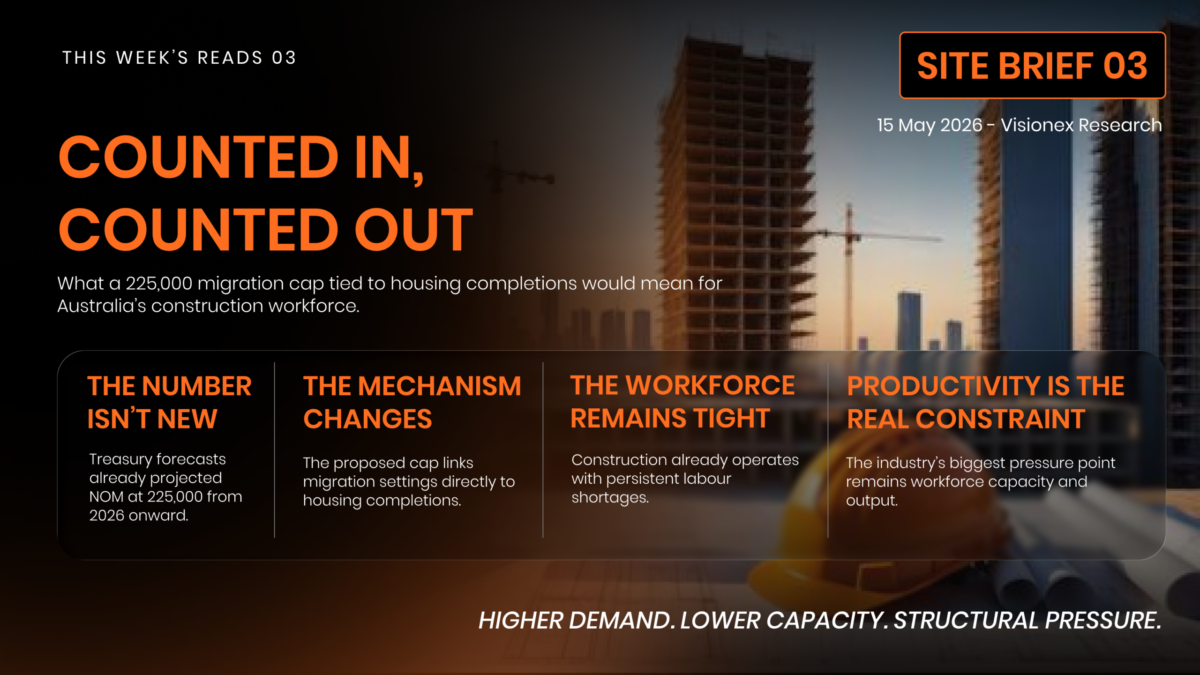
Counted In, Counted Out ; What a 225,000 Migration Cap Tied to Housing Completions Would Mean for Construction Workforce
The Cap Is a Mechanism, Not a Number
On 8 May 2026, Opposition Leader Angus Taylor announced in Canberra that a Coalition government would cap Net Overseas Migration (NOM) at approximately 225,000 a year, tied to Housing Australia’s quarterly dwelling-completion data.
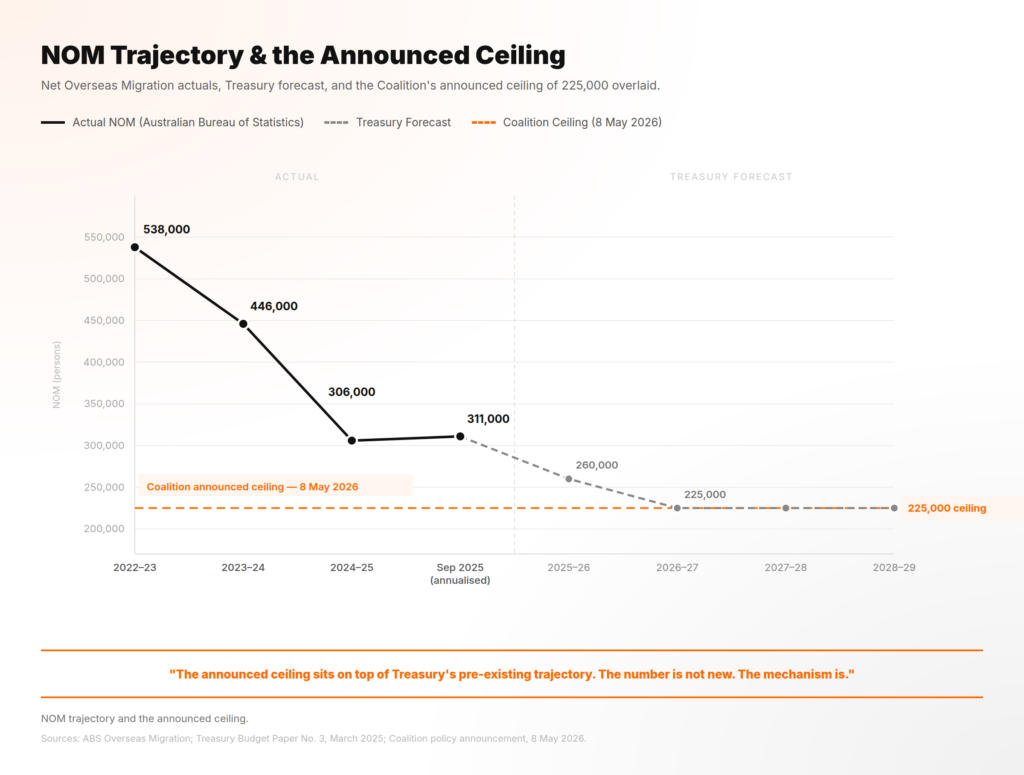
The ceiling has been framed in the public debate as a population-supply policy and a response to the housing shortage. The most recent print, from the Australian Bureau of Statistics (ABS) National, state and territory population release of September 2025, has NOM running at 311,000. The 2024-25 financial-year figure, published by the ABS Overseas Migration release in December 2025, came in at 306,000.
Against either benchmark, 225,000 reads as a meaningful reduction.
Read against Treasury’s own forecast, the policy aligns closely with the government’s existing migration trajectory. The 2025-26 Budget, released March 2025, has NOM moving from 260,000 in 2025-26 to 225,000 in 2026-27, and holding at 225,000 through 2028-29.
The figures appear in Budget Paper No. 3, Appendix A, Table A.5. From 2026-27 onward, the proposed ceiling broadly reflects the same level already outlined in Treasury forecasts, although it introduces a different policy mechanism and framing.
What is new is not the destination, but the enforcement structure. A cap tied to housing completions may operate, in practical terms, as a workforce-supply policy.
Master Builders Australia puts the construction workforce at 1.32 million jobs and the industry at $318.9 billion, or 11.6% of Gross Domestic Product (GDP). Infrastructure Australia’s 2025 Market Capacity Report puts the public infrastructure pipeline at $242 billion over 2024-25 to 2028-29, a 14% increase on the previous year’s projection.
Both rely on the same trades workforce. A policy mechanism linked to housing completions therefore interacts directly with labour availability in a system already facing workforce shortages.
The cap is a mechanism, not a number. The number is already in the Budget. What Taylor announced is the enforcement structure.
Construction’s Quiet Migration Story
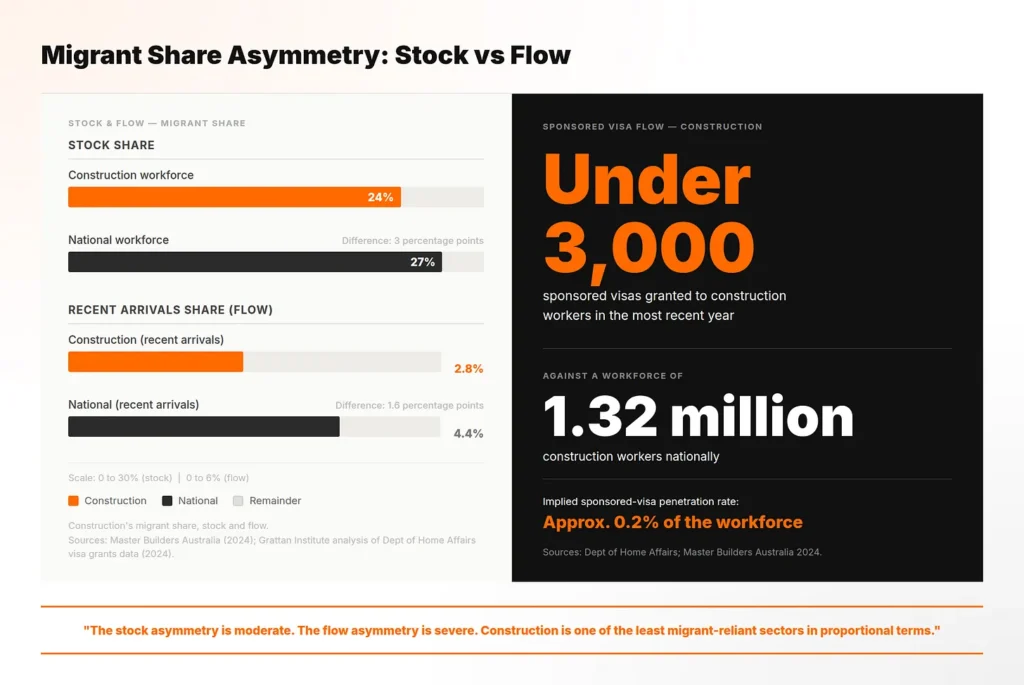
Migrants who arrived in Australia in the five years to the 2021 Census made up 2.8% of the construction workforce. The equivalent share of the national workforce was 4.4%.
The stock comparison runs in the same direction. 24% percent of building and construction workers were born overseas, against 27% of the national workforce. Both figures come from Master Builders Australia’s 2024 submission, The Future of the Workforce: Skilled migrants in building and construction, drawing on ABS Census 2021 Table Builder data.
On both measures, construction sits below the national workforce composition despite ongoing labour shortages.
The migration flow into construction trades is comparatively limited. The Grattan Institute’s 2024 analysis of Department of Home Affairs visa grants data found fewer than 3,000 temporary sponsored skilled worker visas are granted each year to people working in construction trades, against an industry workforce of 1.32 million.
The Australian Industry Group (Ai Group) ’s November 2024 analysis of ABS microdata, Measuring migrants’ contribution to the Australian labour market, found trades represent 13.6% of migrant employment, well below the roughly one-in-three share migrants hold across the wider workforce.
Australia’s skilled migration system has historically been more aligned with tertiary-qualified professions.Grattan’s analysis found 22% of construction workers hold a diploma or higher, the lowest share of any industry. Overseas-qualified tradespeople wanting to work in Australia must complete a separate skills assessment for the visa and a separate state or territory licensing process to legally trade. At the time of the Parkinson Migration Review in 2023, the combined cost was estimated at approximately $9,000, with processing timelines extending up to 18 months for some trades.
The pipeline that a cap on migration would tighten is, for construction trades, already a very narrow pipe.
The Gap, and the Loop That Widens It
The construction trades pipeline produces approximately 22,000 net new qualified workers per year. The National Housing Accord alone requires 90,000. The first figure is an estimate, derived from National Centre for Vocational Education Research (NCVER)’s 54.8% four-year completion rate for the 2019 commencing apprentice cohort applied to annual commencements, plus the marginal sponsored migration flow. The second comes from BuildSkills Australia’s 2024 Workforce Plan, drawing on Oxford Economics Australia modelling. The arithmetic does not require interpretation.
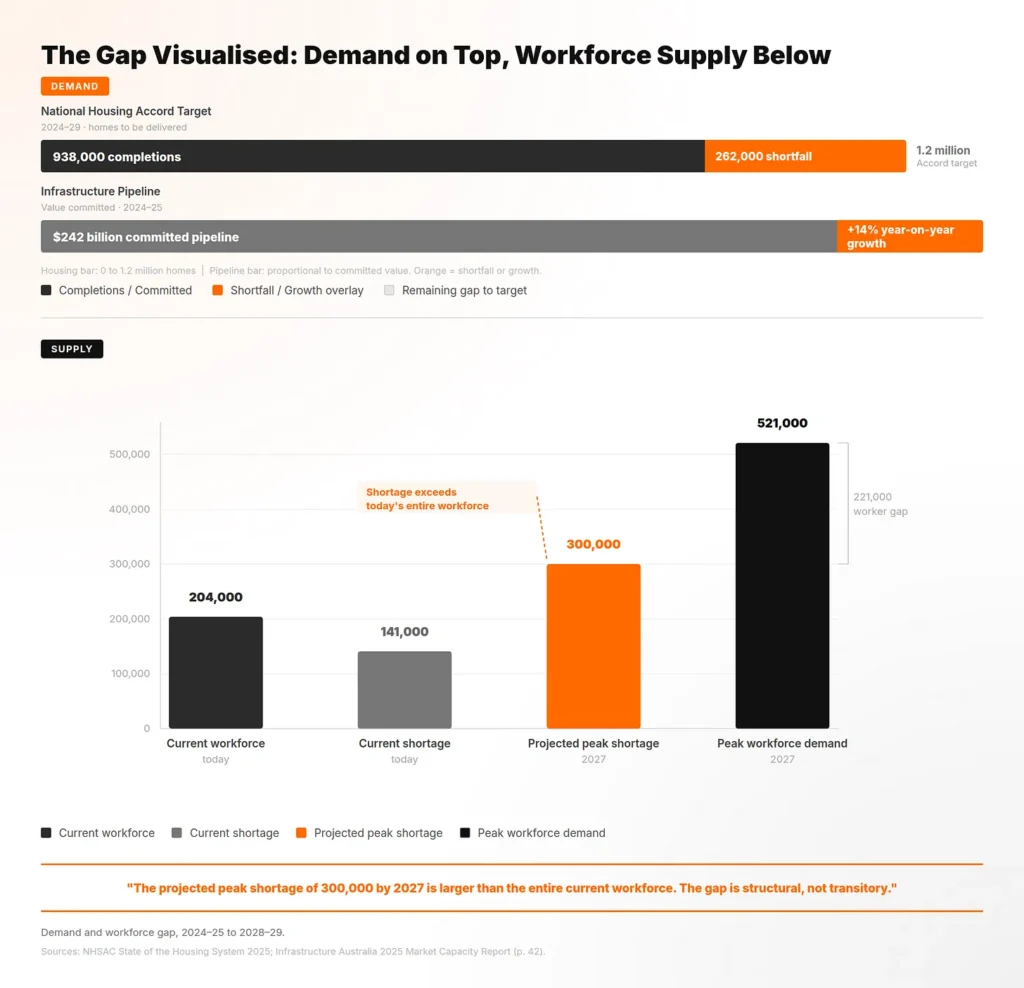
What the workforce is being asked to build is documented in three independent sources. National Housing Supply and Affordability Council (NHSAC)’s State of the Housing System 2025 forecasts 938,000 completed dwellings against the 1.2 million Accord target by 2029, a shortfall of 262,000 dwellings. That is the supply cliff our recent Deep Dive examined in detail.
Infrastructure Australia’s 2025 report puts the public infrastructure pipeline at $242 billion over 2024-25 to 2028-29, up 14% on the previous year’s projection. Its workforce modelling has current public infrastructure capacity at 204,000 workers, current shortage at 141,000, peak workforce demand reaching 521,000 by mid-2027, and peak shortage projected at 300,000 by 2027. The peak shortage exceeds the size of the current workforce. The gap is not marginal, not transitory and not contested in the official record. It is structural and named in three separate official sources.
The gap is the static picture. The loop is the dynamic, and it is the structural reason the gap will not close itself. The cap’s trigger condition is housing completions. Housing completions are heavily influenced by trades workforce capacity. Depending on how temporary migration streams are administered, the policy could place additional pressure on already constrained labour availability at the margin.
When completions fall short of the target, the trigger fires. The next year’s completions miss by slightly more than they would have otherwise. The trigger fires again. Jenner and Tulip’s 2020 Reserve Bank of Australia (RBA) discussion paper estimated the medium-to-long-run price elasticity of apartment supply in Australia at 0.07, meaning supply does not flex meaningfully to demand signals. In a system that already responds slowly to supply pressures, such a mechanism could reinforce the conditions that triggered it. Layered onto an apprenticeship pipeline already contracting and a workforce already structurally short, the cap’s mechanism reinforces the same dynamic from a different direction.
The mechanism does not need to be intentional or large to be consequential. It needs only to bind on the metric the shortage is suppressing.
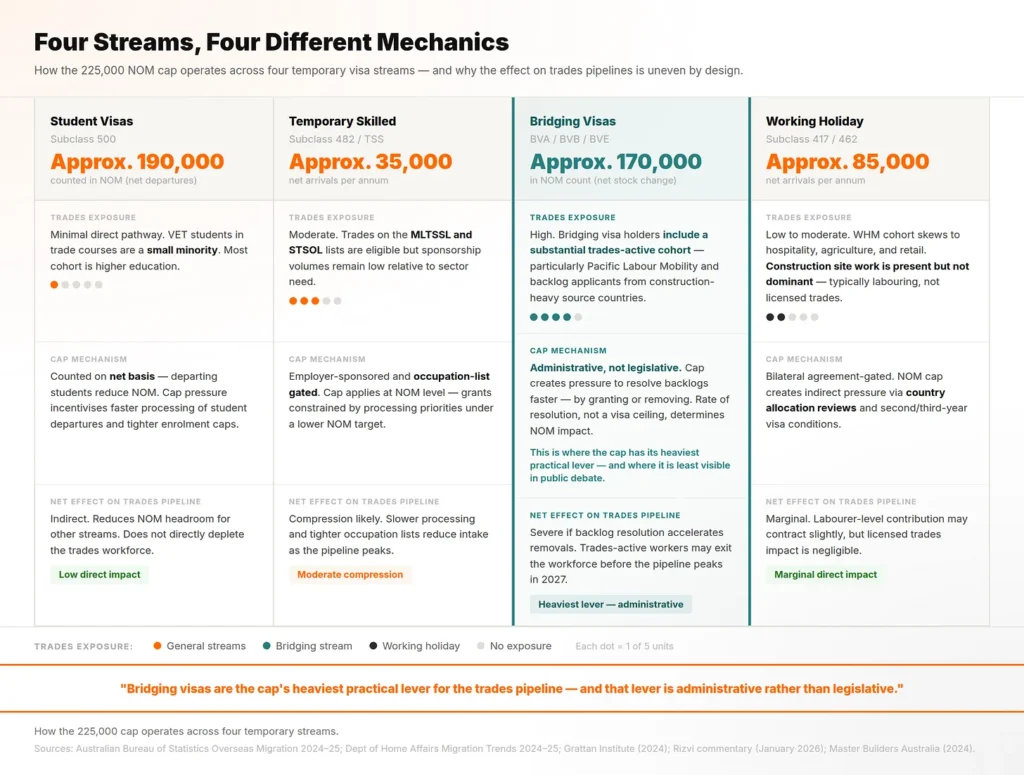
Four Streams, Four Different Mechanics
The 225,000 ceiling has to land somewhere. There are four temporary visa streams it can mechanically tighten. The one carrying the cap’s heaviest practical lever for the trades pipeline is not in the public debate.
Students are the largest single arrivals category. ABS Overseas Migration 2024-25 counted 157,000 international student arrivals in the year to 30 June 2025, close to half of all temporary visa arrivals. The Department of Home Affairs Migration Trends 2024-25 records 94,499 temporary graduate visa grants in the same year. The VET tail of student enrolments includes some construction-relevant qualifications, and the graduate-visa pathway feeds small numbers of trades-trained workers into the construction workforce, but the volumes are slight relative to the stream. The cap’s largest headline NOM reduction can be produced by compressing students. That compression touches construction trades only at the margin.
Working holiday makers are a smaller stream but a more direct one. Home Affairs Migration Trends record 211,000 Working Holiday Maker (WHM) holders at 30 June 2025, a 21.8% year-on-year increase. The cohort is over-represented in construction labouring, demolition, formwork and regional construction work, particularly under the second-year and third-year extension provisions that include construction in northern Australia and remote postcodes.
The stream is not trades-licensed but supplies the labour pool that lets Australian-qualified tradespeople work productively. Bilateral agreements with more than thirty partner countries make unilateral compression politically harder. Any tightening here lands precisely on the regional construction work where Infrastructure Australia forecasts shortages will quadruple between 2025 and 2027.
Temporary skilled is the stream that should be the answer and is not. The 2024 Skills in Demand restructure created three pathways, Specialist Skills, Core Skills and Essential Skills, with a Core Skills Income Threshold band of $76,515 to $141,210 as of 1 July 2025. Trades workers were carved out of the streamlined Specialist Skills pathway. The Skilling Australians Fund levy remains at approximately $5,000 per worker. The policy designed to supply trades was, in its most recent restructure, designed away from doing so. Cap impact on trades volumes is minimal because the volumes are already minimal.
Bridging visas may become one of the areas where the cap operates most directly and least visibly. Former Immigration Department Deputy Secretary Dr Abul Rizvi, writing in Pearls and Irritations in January 2026, identified more than 400,000 onshore applicants on bridging visas, including approximately 100,000 students awaiting onshore visa decisions and 45,000 appealing refusals at the Administrative Review Tribunal. Master Builders Australia’s 2024 submission Finding Australia’s Missing Tradiesidentified trade-qualified migrants already in Australia on bridging visas, awaiting skills assessment or qualifications recognition, as an “underutilised cohort of potential workers”.
If applied to this cohort, the 225,000 ceiling would likely operate through processing-priority decisions rather than legislated quotas. Bridging visa outcomes are administrative, not parliamentary. In practice, administrative processing settings may become more influential than legislative changes in determiningoutcomes for this cohort.
The Binding Constraint
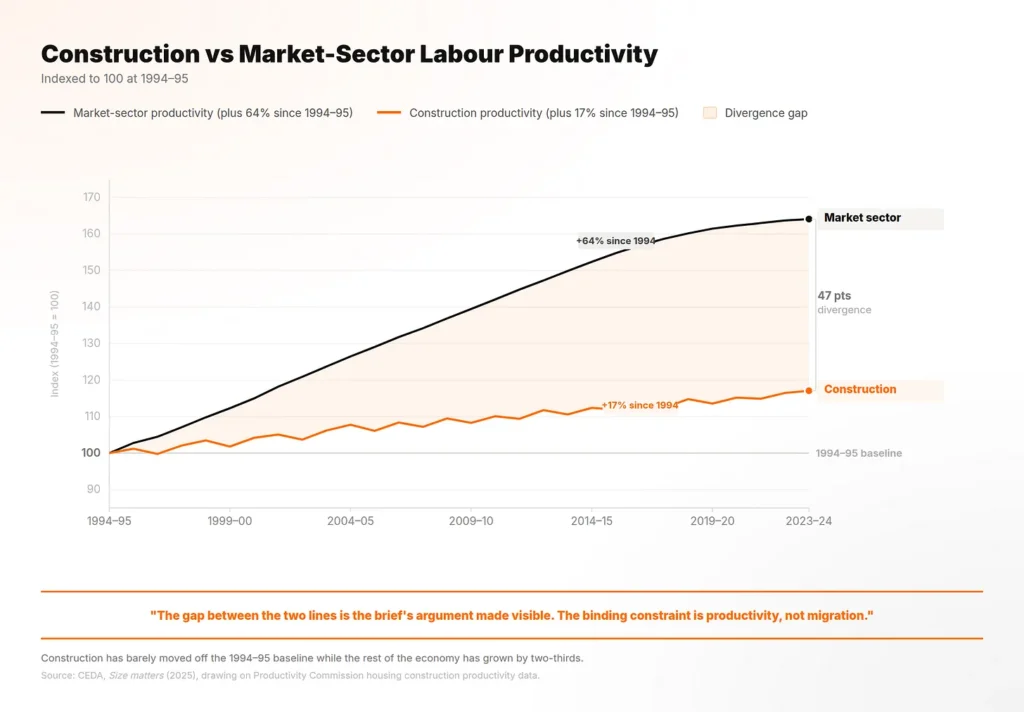
The migration debate operates on a constraint that is not, in fact, migration. The Productivity Commission’s February 2025 research paper, Housing construction productivity: Can we fix it?, found physical dwelling construction productivity has declined 53% since 1994-95. Adjusting for size and quality, labour productivity per hour worked has fallen by 12% over the same period. New houses today are larger and more complex than they were in the mid-1990s (232m² versus 193m²), which explains part of the headline gap, but not the structural shape. Over the same 29-year period, CEDA’s 2025 report Size matters: Why construction productivity is so weak, found construction labour productivity grew 17%. Market-sector productivity grew 64%.
Oxford Economics Australia’s January 2026 analysis estimates the foregone construction output at approximately $62 billion per annum. The research suggests that productivity may represent a more significant long-term constraint on Australian construction output through 2029 than migration volumes alone.
The pipeline that domestic policy assumes will substitute for migration is contracting on a falling commencement base. National Centre for Vocational Education Research (NCVER)’s December 2024 quarterly data shows construction trade workers in training down 11.9% year-on-year, with carpenters down 13.1% and plumbers down 9.2%. Housing Industry Association data shows apprenticeship commencements down 32.5% in 2023-24. The four-year completion rate from NCVER’s 2019 commencingcohort was 54.8%. The supply side is contracting before many recent policy responses have had time to materially affect workforce outcomes.
The policy response is real and undersized. The Albanese government’s Key Apprentice Program, announced at the National Press Club on 23 January 2025 and implemented through Budget 2025-26’s Strategic Review of the Australian Apprenticeships Incentives System, commits $10,000 per apprentice across five milestones, $626.9 million over four years, inside a broader $722.8 million package.
The 2024 Skills in Demand visa restructure reformed the administrative architecture but excluded trades from the streamlined channel. Construction Skills Queensland’s Horizon 2032 program commits $60 million in 2025-26 against a Brisbane Olympics-driven Queensland workforce shortfall projected at 50,000 by 2026-27. These interventions are useful. However, questions remain as to whether these measures are sufficient relative to the projected scale of workforce demand.
The trade-off the industry is being asked to hold is harder than the public debate currently allows. A cap that compresses the small migration channels into trades does not materially improve the trades workforce, because migration is not the marginal supplier of the trades pipeline. A migration program held at current levels does not improve it either, because the structural mismatches between Australia’s skilled migration design and the trades workforce composition mean the program does not flex meaningfully to construction demand. Capped or uncapped, expanded or restricted, the binding constraint on Australian construction output through 2029 is domestic and structural.
The migration cap remains the focus of public debate, while workforce capacity continues to represent a major operational constraint for the industry.
What does this look like from where you’re standing?
For the investors, developers, builders, estimators and consultants reading this: where does the binding constraint show up most sharply in your project numbers? Apprenticeship throughput, productivity at the trade face, licensing recognition, subcontractor capacity, or something this brief has not named? The most useful conversations in this industry start before the data catches up. Leave a comment below
Note: This article is general market commentary and does not constitute financial or migration advice.